The work of a scientist is not just about experimenting in a laboratory. We also spend a lot of time attending meetings and conferences with colleagues and other researchers. There, we present the results of our experiments and explain our hypotheses. Or we write reports of our findings for publication in scientific journals. Either way, to grab people’s attention we need to wrap our ideas in compelling stories.
The use of images, cartoons and sketches is a good way to emphasize your message. It will help your audience visualize and understand complex concepts better. And the act of designing and creating a schematic will help yourself to clarify the key points of what you’re trying to say. I believe, being able to produce eye-catching illustrations is a crucial skill for every researcher, so I decided to share my favorite tools to create and process images.
Why use open source software?
This should be a no-brainer, but I learnt this the hard way. During my studies, I worked at several different institutions, all having different software license agreements. At the time, I was using proprietary reference management programs, such as Citavi and EndNote. When I changed institutes, I couldn’t access my previous reference manager anymore, losing my whole reference library. Then I started my PhD studies and decided to use open source software whenever possible. In this way I could continue working with the programs I had spent time to master. It’s already paying off now that I can create images for this blog from home in my free time.
Creating images from scratch
Inkscape
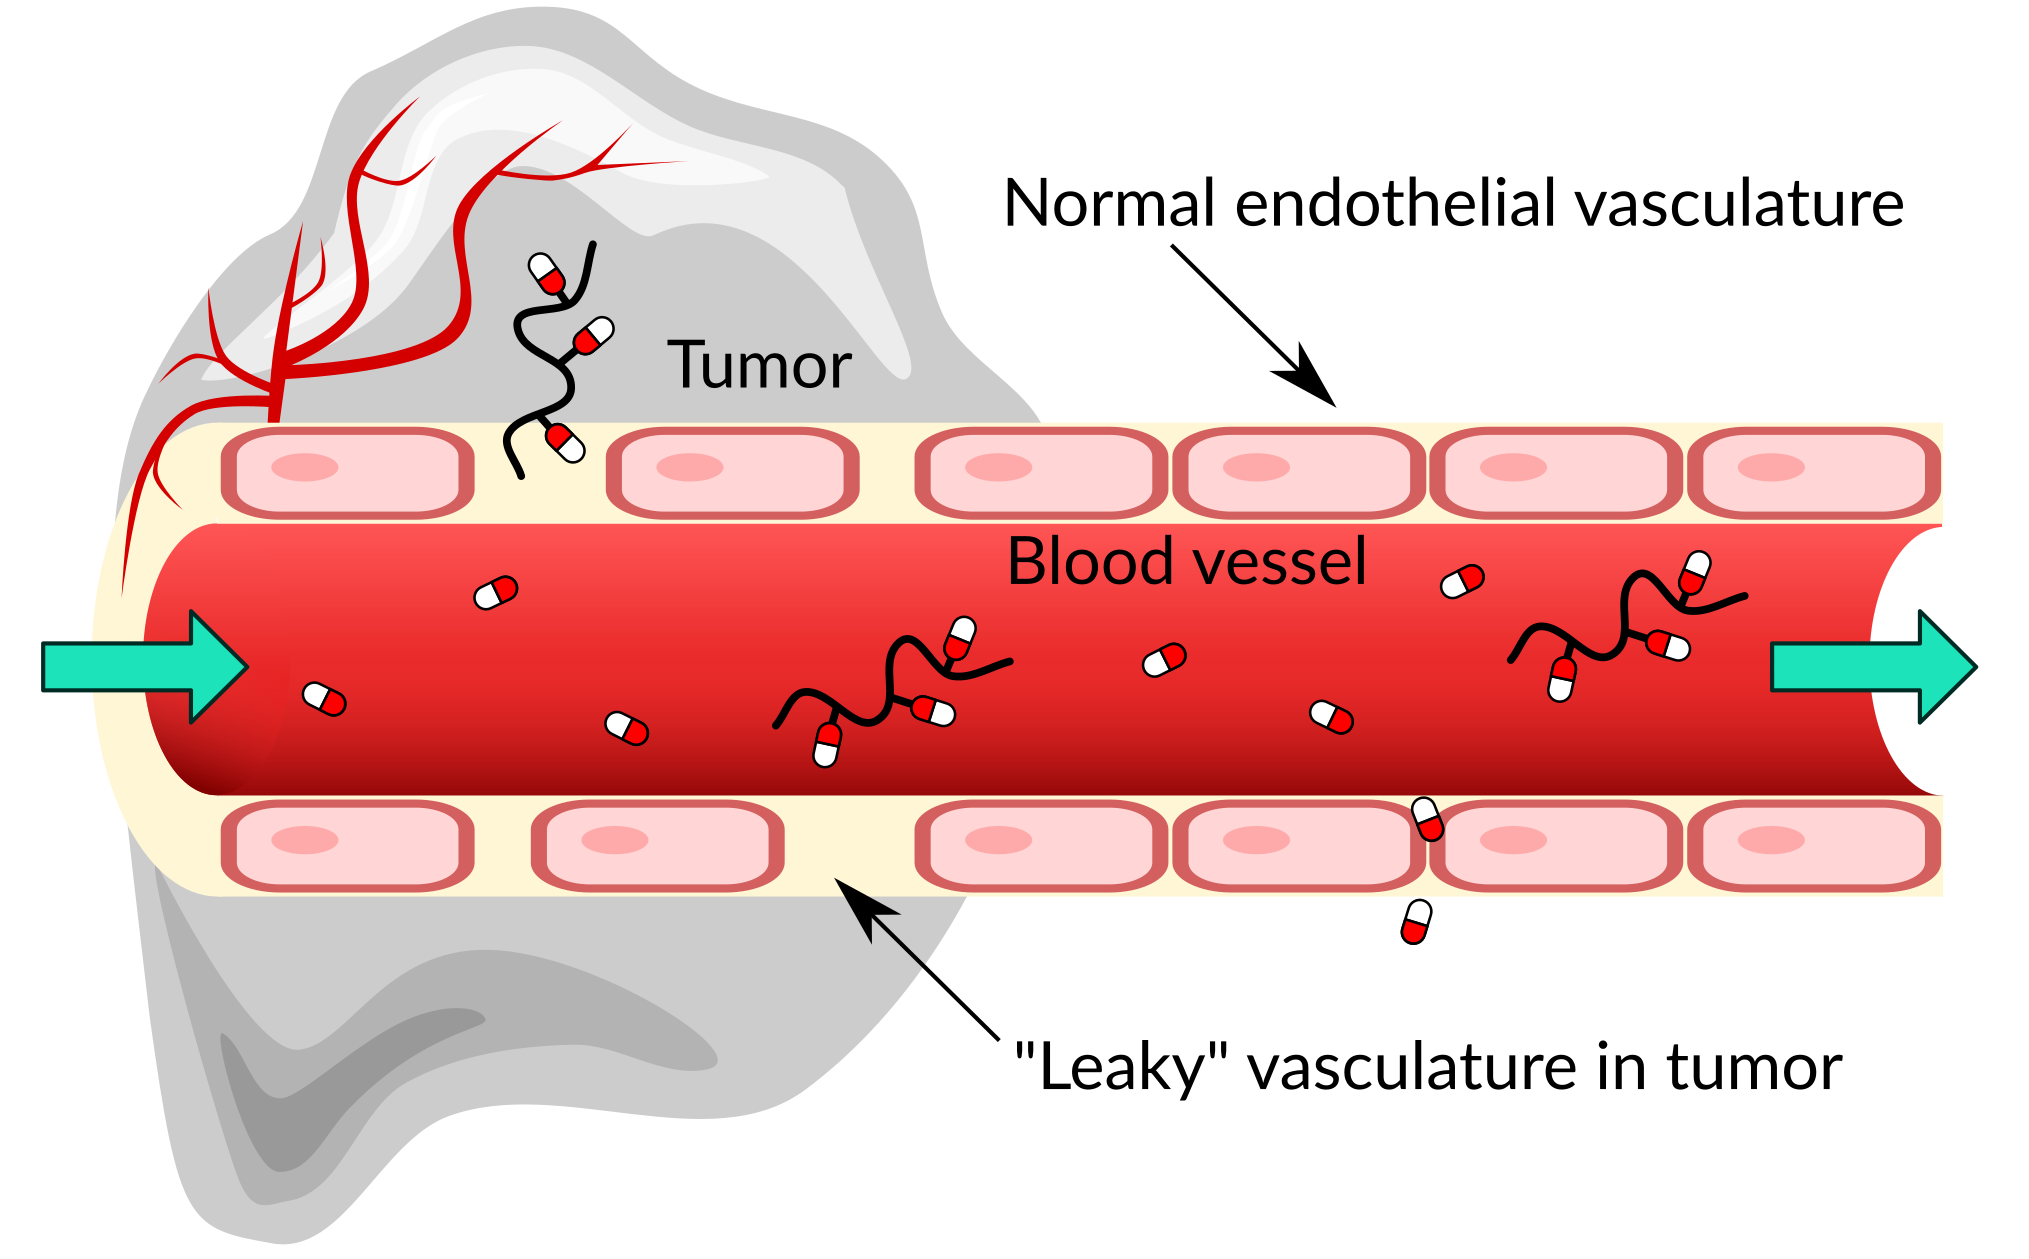
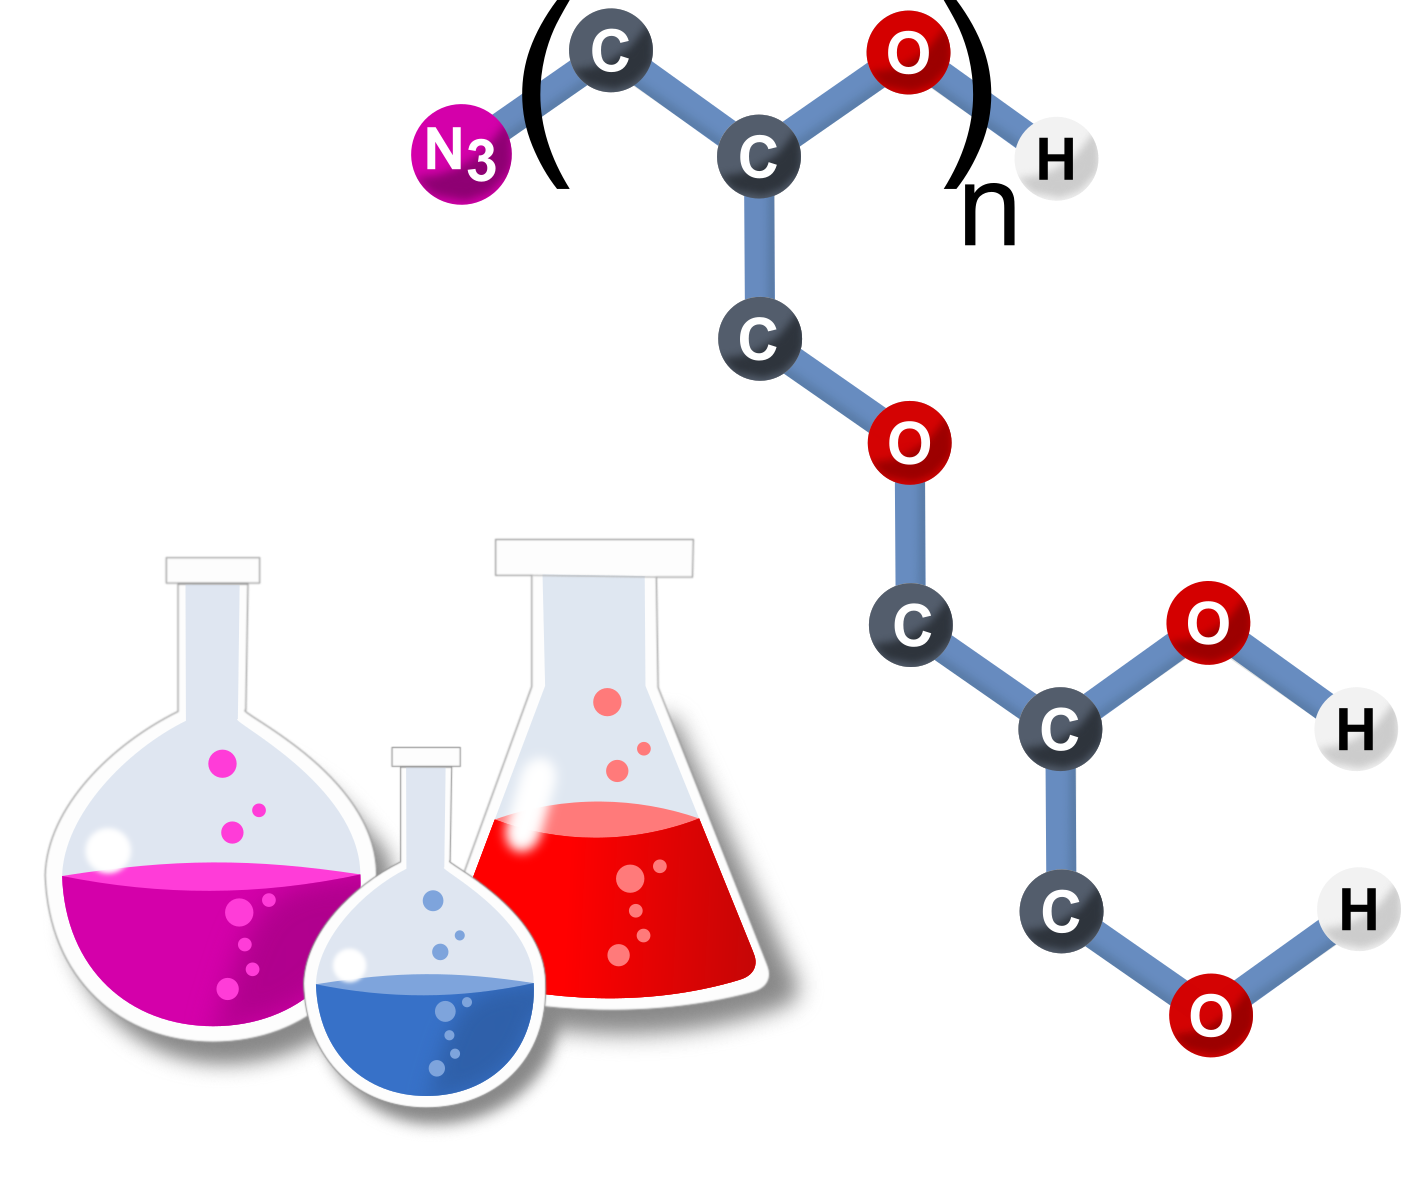
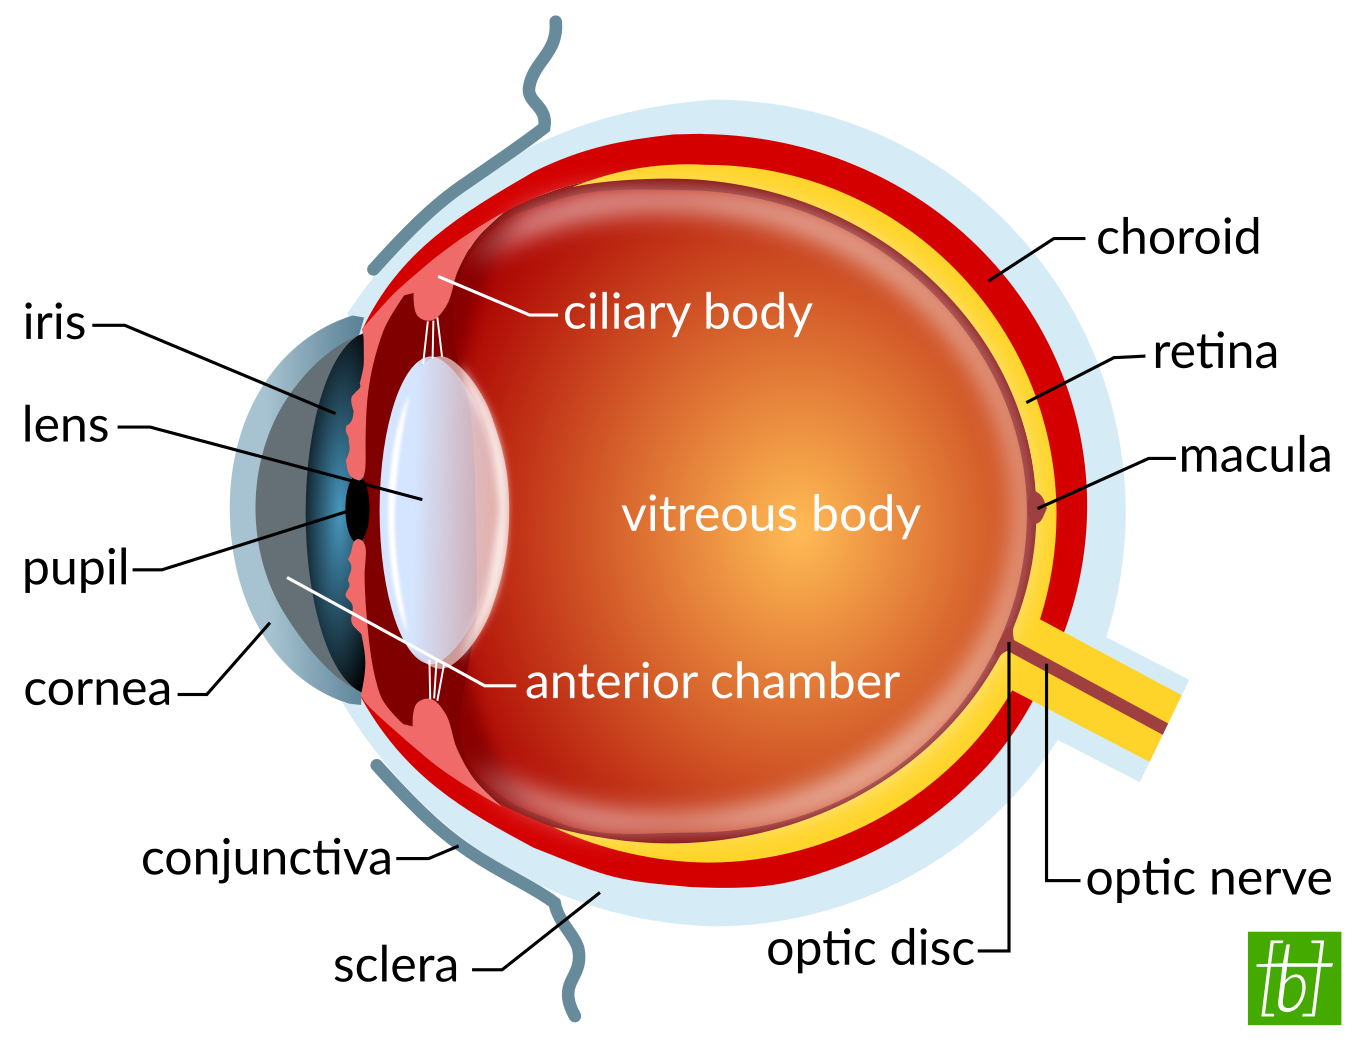
My number one tool for drawing schematics is Inkscape. It’s a professional vector graphics editor for creating scalable images. Since it’s free, you can find a ton of online tutorials on YouTube. I would definitely recommend following a few of those to learn about the path tools. As soon as you have figured out how to join and subtract basic objects, and to transform objects into paths, you can create any shapes you like. Most shapes can be broken down into circles, rectangles, and triangles, and then manipulated from there. I also like the Bézier curve tool for creating freehand objects and the gradient fill option for achieving 3D effects. Here is a selection of images I created with Inkscape:

Blender
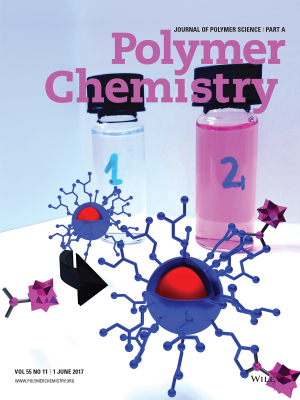
Next on my list is Blender, a program used to make 3D animated images and videos. The operation is rather unintuitive, but the basics can be learned in a weekend by following YouTube tutorials. Being a newbie, I have used Blender to create a journal cover page (shown below). First you have to learn to navigate in the 3-dimensional space and remember a few keyboard shortcuts. After that you can again use basic shapes (spheres, cylinders, cuboids, etc.) to build up your desired objects. You can manipulate the objects by extrusion of different parts of the surface, which is quite fun. To give the objects a specific look, you assign predefined properties to the surface. In this way, you can achieve the look of glass, metal, wood, and much more.
The hardest part for me was to get the lighting right, in order to see the full colors and avoid harsh shadows and overexposed areas. It’s a bit like photography, really. In the end you have to define the camera angle and render the image from this perspective. Furthermore, it’s possible to make amazing animations and videos with Blender, but I’m admittedly no expert in this. I understand that this software is used to make computer games, but I could also see its use for creating visual prototypes of products.
UCSF Chimera
UCSF Chimera is a software developed by the University of California’s Resource for Biocomputing, Visualization, and Informatics (RBVI) Center. It helps to interactively visualize and analyze molecular structures. Or in other words, you can create 3D representations of protein structures and other large biological molecules. Therefore you first search for your desired biomolecule in the RCSB Protein Databank (PDB). Then you fetch the molecule by its 4-digit PDB ID in Chimera. For example, the ID of the major histocompatibility complex (MHC) class I, which presents antigens on the surface of most cells, is 1HSA in the protein databank. You can view your proteins in chain, ribbon, or surface mode, and color and label individual residues or ligands. It’s also possible to display hydrogen bonds or to measure distances between atoms.
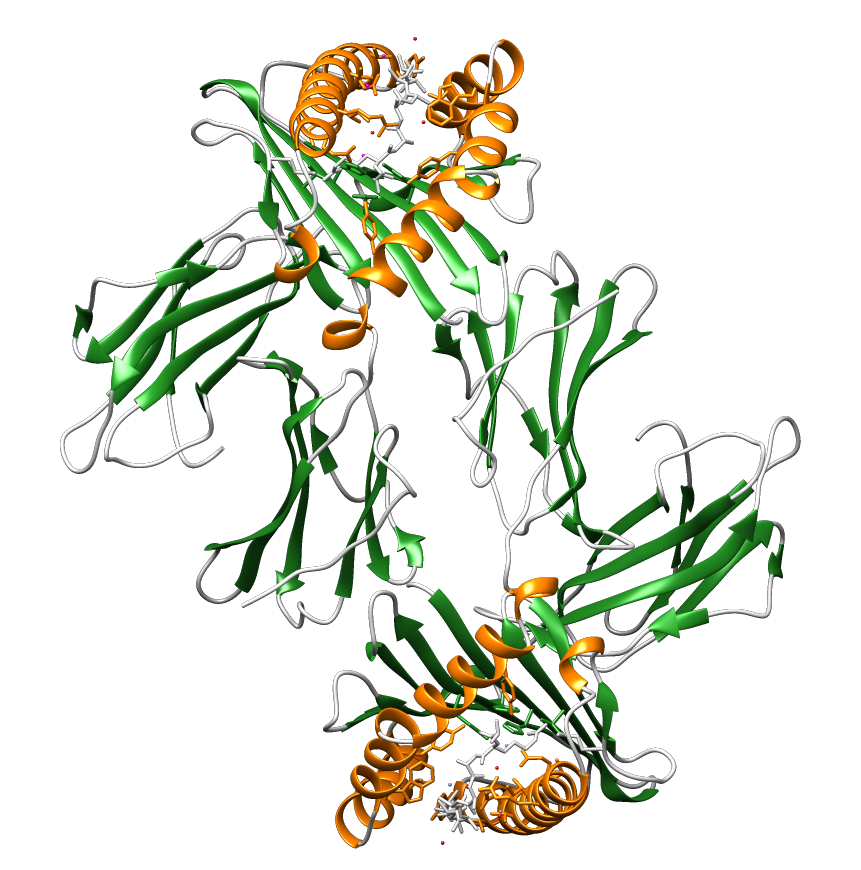
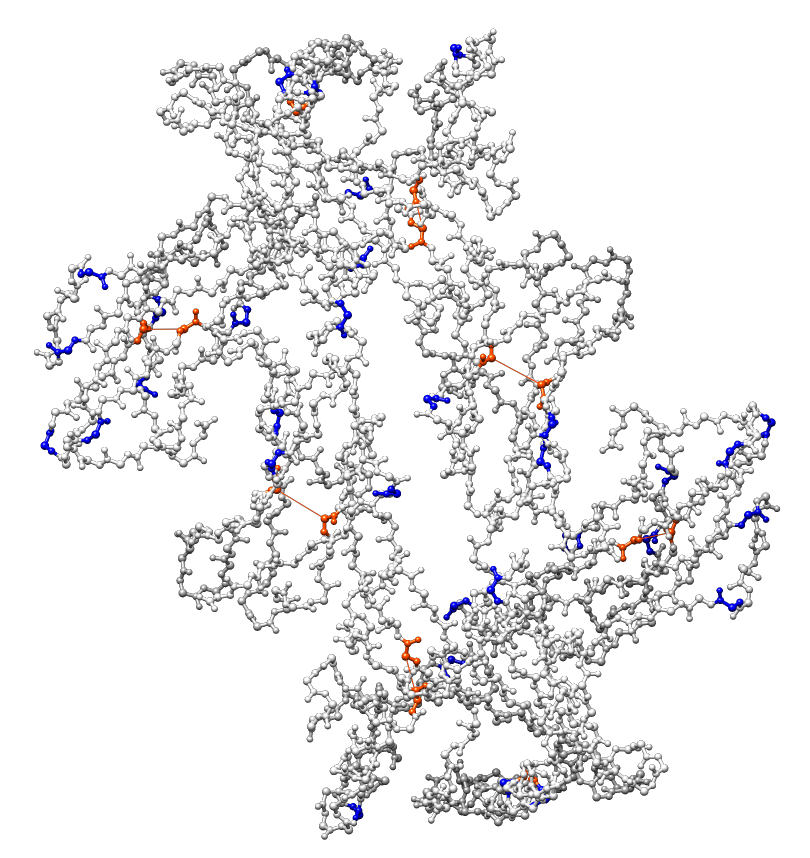
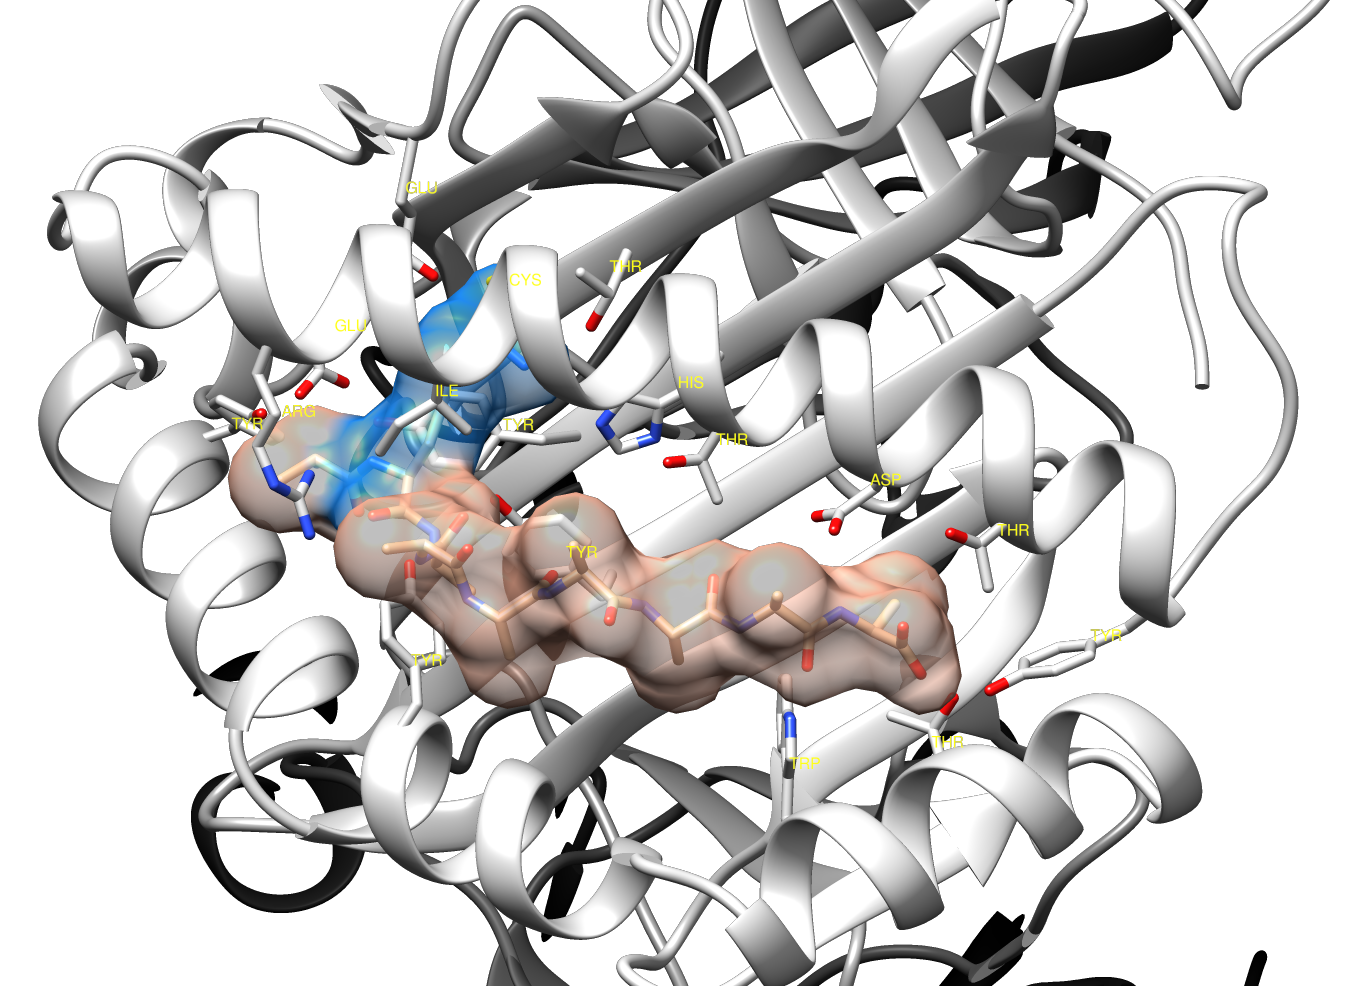
Image processing
GIMP
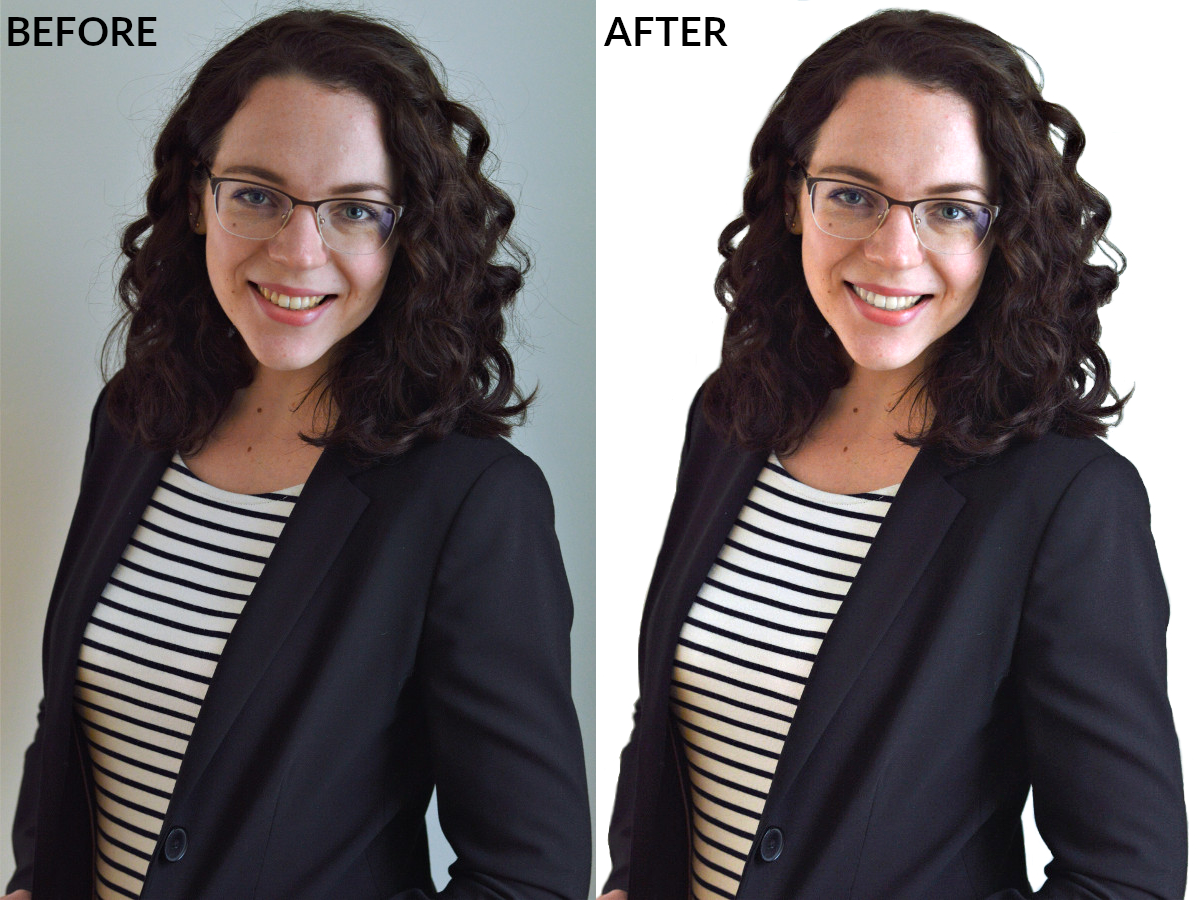
GIMP is an image manipulation program. I mainly use it to edit photos, adjusting brightness, contrast, and color. You can create masks to selectively apply filters or effects to specific areas of a picture. For example, you can desaturate the background to achieve a grayscale effect, while the foreground is still colored. Or remove the background all together. You could also whiten your teeth in photos. 😉
GIMP has similar functions to Adobe Photoshop, but is free to use. There is only one major drawback: to my knowledge, there is no straightforward way to convert the color profiles of images from RGB to CMYK. This would be necessary to achieve vibrant colors in print. If you print RGB images, their colors will look different on paper than on your computer screen. Please let me know in the comments, if you know any free tool that can achieve true CMYK colors.
ImageJ
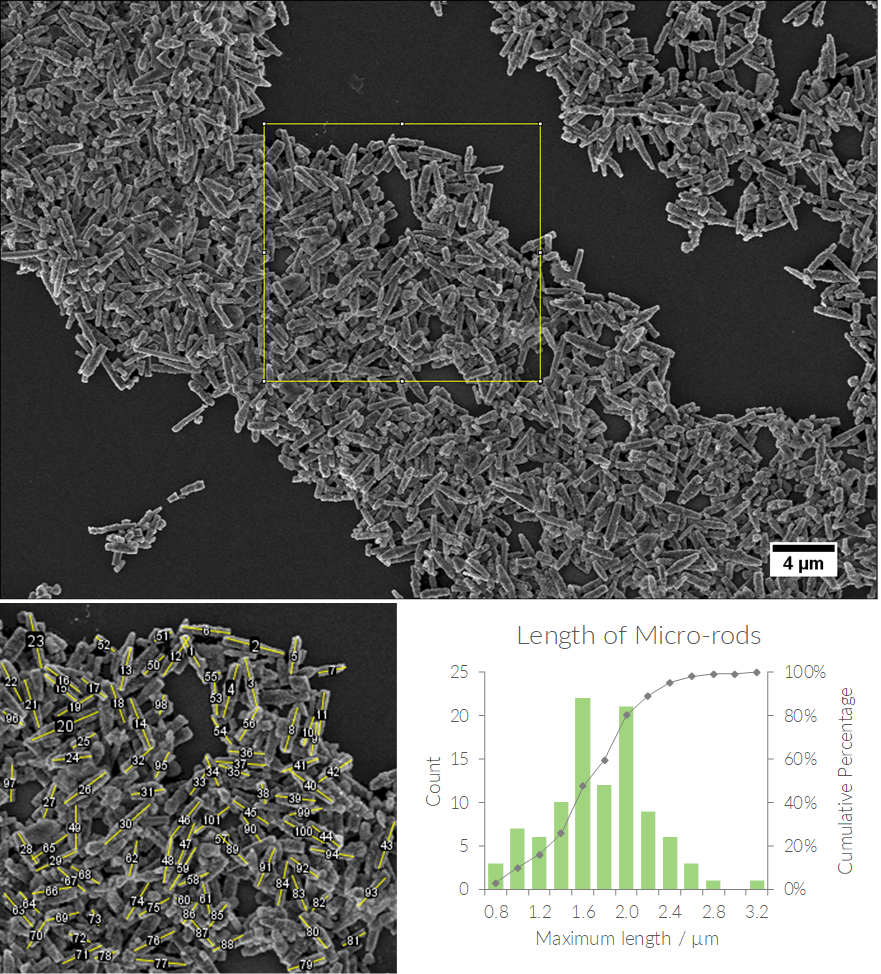
Last but not least is ImageJ, a software most useful for analyzing images of nanostructures or counting cells. Take any microscopy pictures (e.g. AFM, SEM, fluorescence microscopy, etc.) with a scale bar, measure the scale bar and set the global scale for the image. Then you can measure the length or diameter of e.g. nanoparticles manually and add the values to a data table. If your particles are well separated and don’t overlap, you can even analyze their size automatically by setting a recognition threshold. This is useful for plotting histograms of particle size distributions, as shown below. The software can calculate the mean and standard deviation of your data, or you can export the values to the spreadsheet of your choice.
In the example below, I measured the length of the rod-like particles manually as they were overlapping heavily. The square indicates the area that I analyzed and the yellow lines and numbers mark the measured particles. Then I exported the data to Excel and calculated the length distribution, but the ImageJ software can generate a histogram from your measurements as well.
Conclusion
I hope you found this list of free tools for image creation and processing useful and you discovered something new. Well-crafted and thought-out graphs and schematics can help you to get your message across to your audience. I encourage you to start playing around with Inkscape and the likes early, not right before your manuscript submission deadline. It will probably take some trial and error to figure out how to use the software and to refine your ideas for illustrations. Over time, you will become better at breaking objects down into basic shapes and the whole process of creating an image from scratch will be much faster. In my experience, every group seminar talk is a good opportunity to surprise your colleagues with a nice introductory scheme. Please let me know, if you try any of these programs or if you know other free tools that you like!